

12.9
percent growth
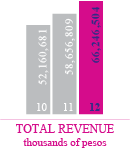
total revenue
17.8
percent margin
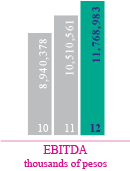
EBITDA


Financial highlights
Figures in thousands of Mexican pesos as of December 31, 2012 and 2011 respectively.


| 2012 | 2011 | %VAR | 2010 | |
|---|---|---|---|---|
| Operations | ||||
| Number of stores | 99 | 90 | 10.0% | 85 |
| Number of shopping centers | 19 | 16 | 18.8% | 16 |
| Own brand credit cards | 3,118,995 | 2,903,472 | 7.4% | 2,700,597 |
| Results | ||||
| Total Revenue | 66,246,504 | 58,656,809 | 12.9% | 52,160,681 |
| Revenue from Retail Division | 58,777,686 | 52,348,382 | 12.3% | 46,730,797 |
| Revenue from Real-estate Division | 2,115,854 | 1,731,041 | 22.2% | 1,551,745 |
| Revenue from Credit Division | 5,352,964 | 4,577,386 | 16.9% | 3,878,139 |
| Operating profit | 10,306,076 | 9,227,815 | 11.7% | 7,727,110 |
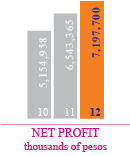
| Net profit | 7,197,700 | 6,543,365 | 10.0% | 5,154,958 |
| EBITDA | 11,768,983 | 10,510,561 | 12.0% | 8,940,378 |
| EBITDA margin (%) | 17.8% | 17.9% | -0.9% | 17.1% |
| Profit per share | 5.36 | 4.88 | 9.9% | 3.84 |